
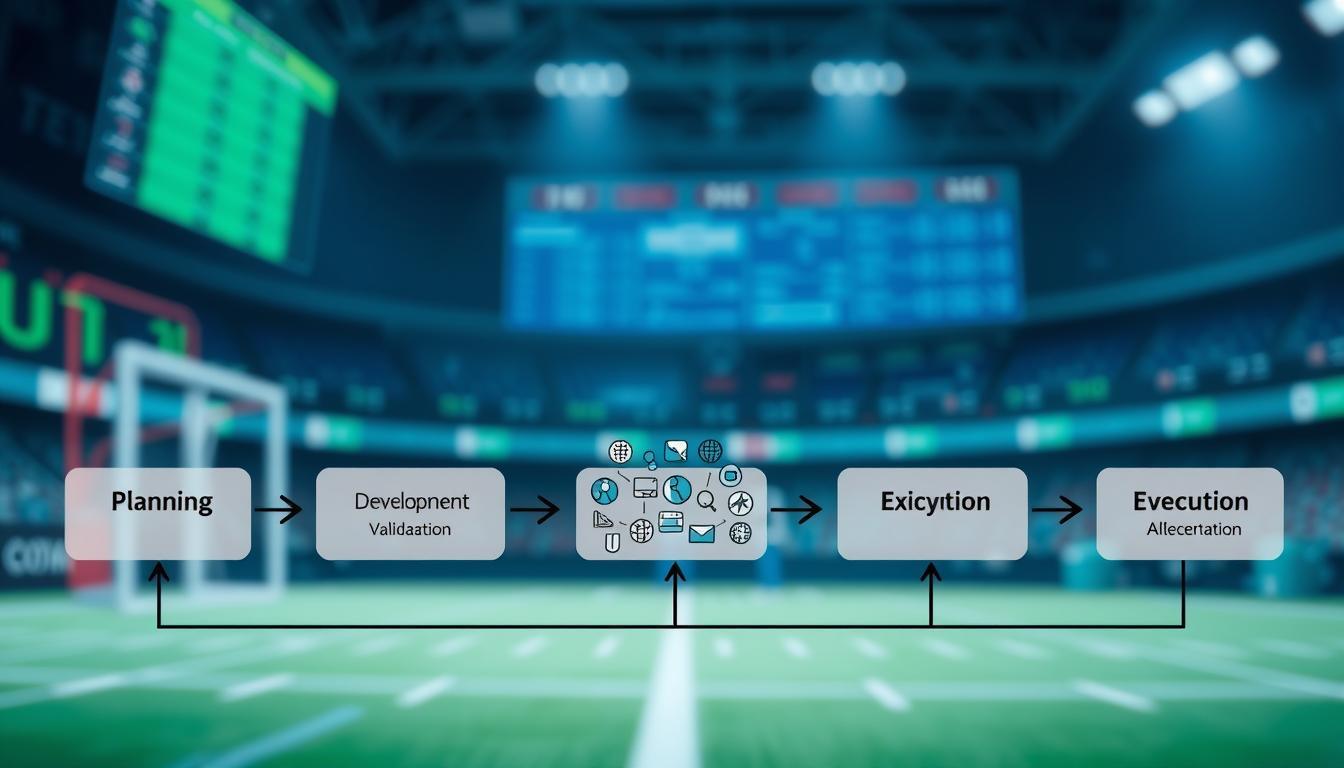
We often think of a modeling error as a big bug in the code. But the truth is more complex. It’s a series of small failures that start early, before any trade is made. It’s like tiny cracks that eventually break the wall.
This series of failures happens in three stages. The first is preparation, where the foundation is laid. Here, bad data and wrong assumptions, like wrong player IDs or odds, harm the model. It’s like rust on the weather vane before a storm.
Then comes the execution stage, where model risk can grow. Dashboards slow down, and in the chaos, humans make quick decisions. These decisions override the model’s logic, showing operational risk in finance.
Lastly, the failure is clear. In the final stage, the damage is too big to ignore. Unchecked data and missing audit trails make fixing the problem hard. The modeling error is now a big problem. It’s not just the code that failed, but the whole process it was built on.
The Validation Suite: Grading Your Model’s Report Card
You wouldn’t push a major code update to production without running your unit tests. So why would you launch a pricing, risk, or fraud model into the wild without a validation suite? This is your model’s report card, the unforgiving final exam it must pass before you trust it with real-world decisions. In the world of trading and risk, a model’s confidence is its currency. The validation suite is the stress test that proves whether that confidence is a bluff or a bankable asset.
Think of your model as a trader. A good trader isn’t just right about a stock’s direction; they’re calibrated. They know the difference between a 60% and an 80% probability of success, and they bet wisely. Our validation suite is how we audit our model-trader. We’re not just asking, “Was it right or wrong?” We’re asking, how confidently right or wrong was it? The difference is everything.

Brier Score: The Model’s Final Grade
Forget pass/fail. The Brier Score is your model’s GPA. It doesn’t just measure if you passed the test; it measures how far your predictions were from the bullseye. It calculates the mean squared error of your probability forecasts. A perfect, clairvoyant model would score a perfect 0.0, while a model that’s just guessing is often around 0.25 for binary outcomes.
Imagine your model predicts a 90% probability of a loan default. If the borrower does default, your model’s “error” is small. But if you predicted a 90% chance of a *favorable* outcome and the opposite happens, the Brier Score punishes that overconfidence. It’s a harsh but fair professor, and it doesn’t grade on a curve.
The Log-Loss: A Punishing But Honest Judge
If the Brier Score is a stern professor, the Log-Loss function is the merciless, no-nonsense headmaster. It’s the metric that doesn’t just penalize a wrong answer—it excruciatingly penalizes confident wrongness. It’s the difference between a gentle “try again” and a dramatic, red-ink “F” in the gradebook.
For a model that predicts a 95% probability of an event, and that event doesn’t happen, the log-loss penalty is brutal. It’s the universe’s way of charging interest on overconfidence. In the world of “theoretical edge” vs. “realized hold,” this is the gap. Your model might promise a 5% house edge (the theory), but the log-loss tells you the brutal truth about what you’ll actually hold.
The Calibration Plot: Are Your Probabilities Trustworthy?
This is where we separate the calibrated from the confidently incorrect. A well-calibrated model that says “70% chance” should be right about 70% of the time. If you plotted a perfect model, all points would sit on the 45-degree line. Your calibration plot is the reality check your model’s ego didn’t know it needed.
If your plot looks like a Jackson Pollock painting—splatters everywhere—your model is either overconfident (points above the line) or underconfident (points below). Good calibration means your probabilities are honest. A model can be a lousy predictor but well-calibrated (it’s consistently wrong in a predictable way, which you can trade against!). A model with great accuracy but poor calibration is a time bomb of overconfidence.
Here’s how the core metrics of our validation suite stack up:
| Metric | What It Measures | Analogy | Perfect Score |
|---|---|---|---|
| Brier Score | Mean squared error of predicted probabilities. Lower is better. | Your model’s grade point average. | 0.0 |
| Log-Loss | Penalizes overconfident wrong predictions exponentially. | The merciless headmaster who hates guesswork. | 0.0 |
| Calibration Plot | How well predicted probabilities match actual frequencies. | The “trust but verify” graph of your model’s honesty. | Points on 45° line |
In the end, a validation suite isn’t a one-time audit. It’s a continuous process, a financial stress test for your model’s probability engine. It’s the difference between a trader who has a “hunch” and one who knows, with calibrated precision, the exact edge they’re playing with. The market is the final, unforgiving backtest. Your validation suite is the brutal, honest training that prepares you for it.
Feature Drift and Data Quality Tests
Your model validation suite is like a car’s dashboard. But, it doesn’t show potholes or road closures. Validation checks if the engine is running, not if the bridge is out. This is where your model can be wrong without showing it.
This isn’t about the math being wrong. It’s about the model’s world not matching reality. This is the silent, slow-burn modeling error.
The Silent Saboteur: How Your Model’s World Changes Behind Its Back
Your pricing or risk model is like a navigator with a detailed map. That map was made from your training data, showing the world as it was. Feature drift is when the landscape changes while you’re navigating.
That “player lifetime value” feature you worked on? It’s now based on a broken CRM integration. Your model is steering you off a cliff with a map of a world that no longer exists. This is a modeling error that no tuning can fix.
Consider the data quality gremlins. Source 2’s “incomplete CRM integration” is a modeling error in the making. Your model sees “Player A” and “Player 123” as different people. This is a modeling error where the input data no longer represents the real-world entity it’s supposed to.

To catch the world changing, you don’t wait for your KPIs to crash. You monitor the data’s vital signs with statistical canaries in the coal mine. Tools like the Kolmogorov-Smirnov test or the Population Stability Index (PSI) are your early-warning system for modeling error.
Think of it as monitoring the signal-to-noise ratio of your incoming data. Is the distribution of a key feature, like “deposit amount” or “session length,” suddenly shifting? That’s not a performance dip; that’s the canary. It could be a broken data pipeline, a change in player behavior after a game update, or a black swan event your training data never saw.
This vigilance moves you from reactive to proactive. Instead of asking, “Why did our churn prediction fail?” you’re asking, “Why did the distribution of user login times shift by three standard deviations last Tuesday?” You’re not just detecting a modeling error; you’re diagnosing the cause of the model error before it becomes a costly business error. You’re not just fixing a model; you’re fixing your view of reality.
Trader Override Governance
The model gives the underdog a 5% chance. Then, a high-stakes bet comes in from a known whale. The trader sees something the algorithm missed and overrides the price.
This is the moment of truth in electronic trading. It’s where human instinct meets the machine’s cold calculus. Without proper governance, this isn’t genius; it’s gambling. We’re talking about structured, disciplined intervention.
Every override should start with a simple question: is this a gut feeling or a data-driven deviation? The difference is everything. One is superstition; the other is strategy.
Our job is to build a system where a trader’s “gut” is just the starting point for a rigorous, data-driven process. This is the core of modern electronic trading risk management, where human insight is amplified by process, not replaced by it.
The Override Playbook: When to Intervene and When to Trust the Machine
An override playbook isn’t a permission slip for hunches. It’s a decision tree. The first branch is simple: risk management or profit-seeking?
Was the override to prevent a catastrophic loss the model didn’t see, or to capture an alpha the model couldn’t see? The playbook demands a clear, pre-defined trigger. Think of it like a fighter pilot’s checklist—no emotion, just procedure.
Let’s say the trigger is a “sharp bet.” The playbook doesn’t say “override.” It says: “If a bettor with a historically high win rate places a bet that is X standard deviations from the model’s prediction, the trader may override, but must log the competitor’s ID, market, and rationale.” The playbook turns a gut reaction into a repeatable, auditable process.
It turns a trader’s edge from a whisper to a whisper network into a systematic edge for the firm.
Here’s where most systems fail: they log the “what” but not the “why.” Our playbook requires tagging every override with a category. This isn’t bureaucracy; it’s data collection. Each category—Market Anomaly, Model Lag, Data Glitch, or Known Edge—gets its own post-mortem protocol.
The Post-Override Audit Trail: Learning from Every Manual Flick
This is where the magic—or the horror—happens. An override without an audit is just a guess with a paper trail. The post-override audit trail is the feedback loop that turns gut feel into a quantifiable edge.
Every single manual intervention must be logged in a system that doesn’t just record the action, but the entire context.
We log the pre-override model price, the new price, the trader’s stated reason, and—critically—the expected value (EV) of the override. Then, we wait. We let the event play out. Did the override make or lose money? More importantly, why did it work or fail? This is where we move from narrative to data.
The most powerful tool in the audit isn’t the profit/loss column. It’s backtesting. By feeding the override scenario and its market conditions back into a backtesting framework, we can ask: was this a one-time anomaly, or a new pattern the model missed? This transforms a trader’s “hunch” into a testable hypothesis for the next model retraining cycle.
The following table outlines a framework for categorizing and learning from trader overrides, turning instinct into institutional knowledge:
| Override Trigger | Trader Action | Audit Trail Data | Post-Trade Analysis | Model Update Implication |
|---|---|---|---|---|
| Sharp Bettor Activity | Adjusted odds on a specific market line | Bettor ID, bet size history, market volatility | Compare model’s prediction vs. actual outcome. Did the sharp bettor know something? | Flag for possible new feature in model (e.g., “sharp money” indicator) |
| Breaking News/Event | Paused model, set manual odds | News source, timestamp, initial market reaction | Could the model have incorporated this data faster? Was the reaction over/under? | Evaluate news sentiment analysis as a new data input. |
| Model Glitch/Outlier Input | Overrode clearly erroneous model output | Data feed source, specific input anomaly | Was this a one-off data error or a systemic model boundary? | Patch data pipeline or add guardrails to model inputs. |
| Regulatory/Limit Hit | Manually limited exposure on a line | Risk limit breached, regulatory flag triggered | Did the model’s risk calculation fail to account for correlated exposure? | Adjust risk aggregation or correlation assumptions in model. |
The audit trail’s final step is the “Lesson Learned” memo. This isn’t a blame report. It’s a brief document stating: Trigger (what happened), Action (what we did), Outcome (P&L and market impact), and the single most important question: Should this logic be coded? If a trader consistently overrides successfully in a specific scenario, that’s not a trader edge—it’s a model weakness. That’s the gold. The override log becomes the training data for the next, smarter model.
Governance isn’t about stopping overrides. It’s about ensuring every flick of the manual switch is a flick of the data collection switch too. It turns a trader’s “I had a feeling” into a firm’s “We have a hypothesis.” The goal isn’t to eliminate the human. It’s to turn human intuition into a systematic, backtestable, and improvable asset. Because in the end, the best model is one that learns, and sometimes, the most valuable training data comes from a human who saw what the machine missed.
Incident Postmortems
When a model fails, it’s easy to point fingers. But in the world of model risk management, the focus is on learning, not blaming. A postmortem is like a film review, teaching us how to do better next time. It’s about understanding the system, not just who to blame.
From Blame to Blameless Autopsy
A blameless postmortem is like a scientific inquest, not a trial. It aims to understand how the failure happened, not who’s to blame. By looking at the process and data, we can find where things went wrong.
This shift is essential. Without a blameless culture, we don’t get the truth. We get cover-ups instead. A blameless culture encourages honesty, turning failures into learning opportunities.
The Five Whys of a Model Failure
The “Five Whys” technique is a powerful tool for understanding failures. It asks “Why?” five times to find the real cause. This method helps us go beyond the surface to the root of the problem.
Let’s use it on a real model failure: a fraud detection model starts approving too many fake transactions.
| Why? (Level 1) | Why? (Level 2) | Why? (Level 3) | Why? (Level 4) | Root Cause (Level 5) |
|---|---|---|---|---|
| Why did fraud spike? Model approved bad transactions. | Why? The model’s fraud score threshold was too low. | Why? The threshold was auto-adjusted by an A/B test. | Why? The A/B test didn’t have a ‘fraud-only’ sandbox environment. | Root Cause: No isolated testing environment for high-risk parameter changes. |
| Why did the test fail? It used 6-month-old training data. | Why? The data pipeline for the test was misaligned with production. | Why? The data pipeline team and model team use different “data freshness” definitions. | Why? No shared SLA for ‘stale’ data between teams. | Root Cause: No cross-team SLA on data freshness for model testing. |
| Why did no one catch it? Alerts were delayed. | Why? The alert was based on model confidence, not P&L impact. | Why? The monitoring dashboard only tracked model metrics, not business KPIs. | Why? Model and business metric dashboards are owned by different teams. | Root Cause: Monitoring is model-centric, not business-outcome-centric. |
This isn’t just theory. Each “why” uncovers more, from the technical issue to the systemic problem. The goal is to find a single, fixable flaw, not to blame someone.
This approach turns failures into valuable lessons. It helps teams learn and grow, making them stronger. The aim is to fail smartly and learn fast, ensuring every postmortem improves the model and the team.
Documentation Standards: The Boring Thing That Will Save You
Documentation is your shield in the world of model risk. It’s the detailed work that protects you when someone questions your model. Without it, your complex algorithm looks like a mystery box, inviting trouble.
From Jupyter Notebook to Production: The Documentation Pipeline
The path from a Jupyter notebook to a live model is full of changes. A solid documentation pipeline guides you through these changes. It tracks every detail, from assumptions to data sources, making your model’s journey clear.
This isn’t about making a dusty manual. It’s about creating a clear story for every choice you make.
The Model Card: Your Model’s Passport
The Model Card is like your model’s passport. It shows where it was born (the training data) and its features. It also lists its biases, failures, and how it performs in different groups.
This document explains why your model makes certain decisions. It turns a mysterious algorithm into a responsible, accountable asset. This is the key to making your model a valuable, auditable model risk management tool. It’s the essential, yet boring, work that makes your model transparent and responsible.