

Think about your trading operation. Now, imagine its data supply chain as its central nervous system, not just a simple pipeline. Every tick, every quote, every blip of market data is a vital signal. But where does it all come from?
This isn’t about drawing a simple flowchart. It’s a forensic audit of your informational lifeblood. We’re not just talking about the primary feed from a single data provider. We’re talking about the entire pipeline: the primary feed, the backup from a secondary aggregator, the tertiary fallback to a derived source, and the reconciliation engine that makes sense of it all.
If that sounds complex, it is. A failure to map this is like navigating a reef in the dark. One hidden point of failure—a single point of failure at a key vendor—can sink your entire strategy. It’s the difference between having a treasure map and just wandering the high seas.
Without this map, you’re not just flying blind; you’re flying straight into the storm of informational asymmetry. Mapping your data supply chain isn’t an IT project. It’s the foundational step in building operational resilience.
Dual-Feed Architecture and Reconciliation
In the high-stakes casino of high-frequency trading, relying on a single data feed is like going all-in with a pair of twos. It’s not a strategy; it’s a prayer. Dual-feed architecture isn’t just a backup plan; it’s your financial airbag. It’s the engineering equivalent of having a spare heart. You don’t wait for a heart attack to wish you had a backup.
This architecture runs two or more independent data streams in parallel. If one fails, the other keeps your trading heart beating.

The Redundancy Principle
A Formula 1 team doesn’t bring just one set of tires to a race. The redundancy principle isn’t about having a spare tire in the trunk; it’s about having a full pit crew and a backup car ready to go. In data terms, it means architecting your system so that the failure of any single feed, or even a critical component, is a non-event.
The primary feed is your thoroughbred racehorse—fast, optimized, and high-strung. The secondary feed is your sturdy workhorse—slightly slower, perhaps, but unflappable and reliable. The principle isn’t just about having a Plan B; it’s about having a Plan B that’s already in the race, running parallel, before Plan A even breaks a sweat.
This is the core of a resilient data infrastructure that can withstand single points of failure.
Implementation and Reconciliation
Running two feeds is the easy part. The real brainpower goes into the reconciliation engine. This is the unsung software that sits in the middle, playing a high-speed, high-stakes game of “spot the difference” in real-time. It’s not just listening to two sources; it’s conducting a symphony orchestra where every instrument must be perfectly in tune.
Your primary feed might be a low-latency, direct-from-exchange feed—a WebSocket stream delivering prices in sub-millisecond bursts. Your secondary might be a more traditional, aggregated REST API feed from a data aggregator. They will, inevitably, disagree. The reconciliation engine’s job is to decide, in microseconds, which data point is the “truth.”
Is that 0.0001% price difference a golden arbitrage opportunity, or is Feed A just 5 milliseconds ahead of Feed B? The reconciliation logic must account for latency, jitter, and the order of operations in the data stream itself.
The choice of feed technology is a cornerstone of this architecture. The table below outlines the core trade-offs between the two primary methods of data delivery, each with its own latency and data-freshness profile:
| Feature | WebSocket Stream | REST API Polling | Primary Use Case |
|---|---|---|---|
| Latency Profile | Ultra-low, persistent connection | Higher, request-response cycle | Real-time price ticks |
| Data Freshness | Near-real-time, push-based | Snapshot-in-time, pull-based | Historical analysis, fallback feed |
| System Load | Low overhead per message | High, with frequent polling | Backup/Redundant feed |
| Implementation Complexity | High (connection mgmt, state) | Low (simple HTTP requests) | Defines primary vs. backup |
Implementing this isn’t just about plugging in two cables. The reconciliation engine is the unsung hero. It doesn’t just choose a “winner” between two conflicting data points. It uses a rules-based logic: Is this a genuine price movement, or a data hiccup? It cross-references with other data sources, checks for reasonable value deltas, and applies a configurable confidence score to each feed.
This isn’t a backup; it’s an active, intelligent, decision-making layer. It’s the pit crew that changes all four tires before your primary feed even realizes it has a flat.
In the end, a robust dual-feed system with smart reconciliation isn’t an IT cost. It’s the ultimate insurance policy. It’s the difference between watching a single, flickering candle in a storm and knowing the entire power grid is backing you up. The redundancy isn’t just about having a spare tire; it’s about having a pit crew ready to change it while you’re winning the race.
Latency Monitoring and SLOs
In the world of algorithmic trading, latency is key. A few milliseconds can mean the difference between profit and loss. You can’t manage what you don’t measure, and you can’t improve what you don’t define.
Latency monitoring and Service Level Objectives (SLOs) are your early warning system. They help you stay ahead of problems.
Defining and Measuring SLOs: The Contract with Your Algorithms
Setting a Service Level Objective for data latency is not about speed records. It’s about setting a threshold where delays become risks. Is your system’s acceptable performance the 99th percentile at 100ms? The 99.9th at 150ms?
The SLO is your promise to your trading algorithms.
For example, a market data provider might promise 25ms average latency. But an SLO is about consistency, not just speed. You want “fast enough, always.”
When your primary data feed consistently breaches its SLO, it’s a warning. Your system’s failover logic must be ready to act.
Here’s how latency benchmarks might compare across different data operations:
| Data Feed Type | Typical SLO Target (p99 Latency) | Industry Benchmark | Risk Level |
|---|---|---|---|
| Equity Price Feeds | < 100ms | Ultra-Low Latency | Critical |
| Options Pricing Stream | < 150ms | Low Latency | High |
| Regulatory Data Feeds | < 500ms | Standard | Medium |
| Consolidated Tape (SIP) | < 1 second | Market Data | Market-Wide |
Proactive Monitoring: The Crystal Ball for Your Data Feed
Proactive monitoring is like seeing the crash before it happens. It’s not just about watching a single number. It’s about understanding your data’s entire performance.
This is where a failover mechanism becomes critical. When your monitoring system detects a breach, it doesn’t just send an alert. It triggers an automated failover sequence.
Think of it as a pit crew for your data pipeline:
- Detection: The monitoring system identifies a sustained SLO breach.
- Verification: A quick health check confirms the primary feed is failing its contract.
- Initiation: The system automatically routes all queries to a pre-configured, redundant secondary feed.
- Seamless Handoff: The failover is designed to be seamless. Your trading algorithms might only notice a slight, acceptable blip in performance.
This isn’t just about speed; it’s about building a resilient nervous system for your data. Proactive monitoring and SLOs turn your data infrastructure into a self-healing, fault-tolerant network. You’re not just watching numbers; you’re predicting the next slowdown and having the failover ready to step in before your algorithms even notice a problem.
Fallback Pricing and Market Suspension
When your main data feed stops working, your fallback pricing is your financial safety net. It’s the key to avoiding chaos and manual fixes. It’s not just a backup; it’s a solid plan for when your data providers fail.
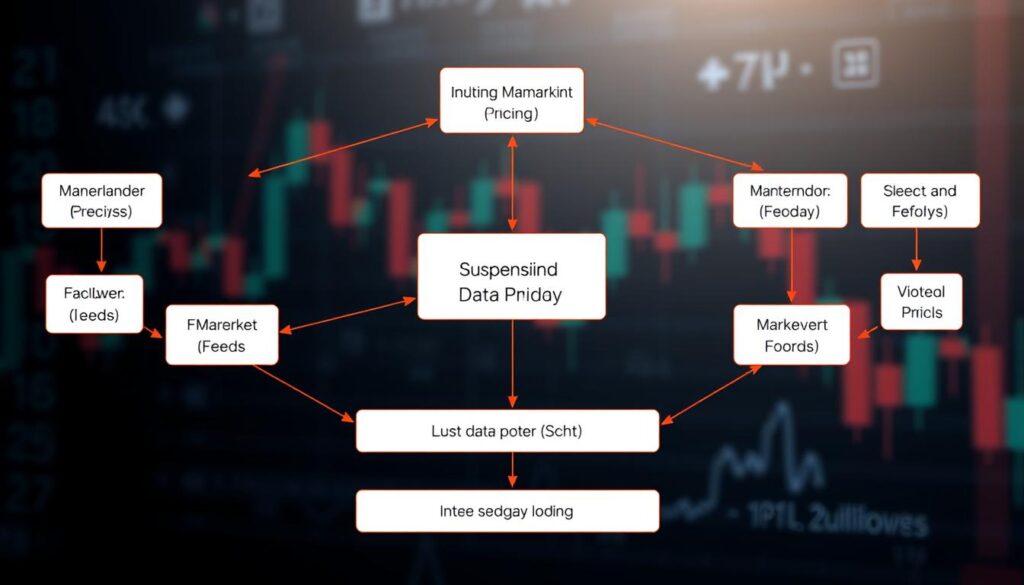
Think of it this way: when your main data feed goes down, the market doesn’t wait for you. Your fallback is a financial emergency plan. A bad fallback can lead to bad trading outcomes. The key is to have a good plan in place before things go wrong.
The Fallback Trigger
When should your system switch to fallback? The trigger is the heart of your plan. It can’t just be a simple timeout. It needs to be smart, like checking for data feed divergence or sudden price spikes.
A good trigger is fast but also careful. It should avoid false alarms during normal market times. For example, a timeout of more than two seconds might be a good start.
But a simple timeout isn’t enough. Your trigger should also check if the data is trustworthy. This means looking at uptime stats and comparing with a secondary feed. A small difference in uptime can mean a lot in terms of risk.
The Resumption Protocol
Going back to normal operations can be tricky. The market keeps moving while you’re on backup. Your Resumption Protocol must smoothly switch back to the main feed without disrupting prices.
This isn’t just a simple switch. You need to make sure the main feed is stable and accurate. This “handshake” period is key to avoiding price flickering. Your protocol must define when it’s safe to switch back, ensuring no price gaps.
In short, your fallback and resumption plans are like market guardians. They keep the market stable, even when things go wrong.
Incident Response Runbooks
When a critical data feed fails, you don’t need a committee meeting. You need a playbook. An incident response runbook is not just a dusty binder. It’s a living guide for handling chaos.
When your primary data feed fails, a good runbook turns panic into action. It makes your response smooth and controlled. Without it, your trading desk could be left in the dark.
The Playbook for Chaos
An effective runbook is like a flowchart, not a novel. It’s a clear, step-by-step guide for when things go wrong. It helps your team act fast, without hesitation.
The core of this playbook is immediate and automated failover. The first step is to trigger the failover to a backup. This is done automatically, without debate, to keep data flowing.
Post-Mortem and Iteration: The Culture of Learning
The incident isn’t over when the system recovers. The post-mortem is where real value is found. It’s about learning, not blaming.
This process is all about growth. Every failure teaches us something new. We update our runbook with these lessons, making it better each time.
A runbook is your guide when things go wrong. It tells your team what to do and when. This way, your response is always ready and effective.
Vendor Scorecards
Think of your vendor scorecard as a strategic dashboard, not a report card. It’s your guide to making smart partnership choices based on data. It goes beyond just uptime, showing the real cost of working together.
Quantifying Performance Beyond the SLA
Move past the simple SLA. A good vendor scorecard looks at the whole experience. It checks uptime, latency, and data feed speed. But it also looks at the effort needed to work with the vendor.
How much time do your engineers spend on vendor issues? How fast do they respond to problems? This “soft” data can turn a vendor into a valuable partner.
The Scorecard in Action
Let’s look at two examples. Provider A has 99.9% uptime, and Provider B has 99.95%. They seem close. But the scorecard shows more.
Provider B might take 4 hours to respond to a support ticket, while Provider A takes 24. Provider B might only give 30 days’ notice for API changes, compared to Provider A’s 48 hours. The scorecard makes these differences clear.
This isn’t about blaming anyone. It’s about making smart choices. It turns vendor management into a proactive, value-driven partnership.